A Data-Informed Approach to Picking Smarter Numbers
Most players know Powerball offers steep odds, 1 in 292,201,338 for the jackpot. But what if smarter number selection isn’t about predicting the future, but understanding the real patterns of how numbers behave after they appear?
That’s the foundation of the Powerball Number Cycling System, a data-driven strategy based on actual historical patterns rather than lottery myths. This approach uses 15 years of verified Powerball data to identify when numbers are most likely to reappear.
The Reality of Randomness
Let’s start with facts, not fiction.
Each Powerball drawing selects five numbers from a pool of 1 to 69. Under purely random conditions, any recently drawn number would have a 5-in-69 chance (≈7.25%) of appearing again in the very next draw.
But here’s what 1,805 actual Powerball draws from February 2010 to July 2025 reveal about real number behavior:
What the Data Actually Shows
After analyzing 8,956 gaps between number appearances, here are the verified statistics:
| Statistic | Actual Value |
| Median gap between appearances | 9 draws |
| Average gap between appearances | 13.1 draws |
| Gaps of 20 draws or fewer | 79.8% of all cases |
| Gaps of 90+ draws | 0.12% of all cases |
| Shortest gap | 1 draw (back-to-back) |
| Longest gap observed | 140 draws |
Key Insights:
- Most numbers reappear quickly—within 5-20 draws (2-10 weeks)
- The typical wait time is 9 draws, not months or years
- “Overdue” numbers (absent 50+ draws) are statistical outliers, not patterns
- Back-to-back repetitions happen, but immediate repeats are less common than 5-20 draw cycles
The Sweet Spot Strategy
Rather than chase mythical “overdue” numbers, smart players should focus on the statistical sweet spot where numbers actually tend to reappear.
Here’s how the Number Cycling System works:
Step 1: Categorize Numbers by Absence
- Recently drawn (1-4 draws ago): Slightly deprioritize
- Sweet spot (5-20 draws ago): Prioritize heavily
- Moderate absence (21-40 draws ago): Standard consideration
- Long absence (41+ draws ago): Deprioritize
Step 2: Build Your Pool
Focus on numbers that haven’t appeared in 5-20 draws—this represents 52% of all successful reappearances in the historical data.
Step 3: Apply Smart Elimination
Instead of avoiding recently drawn numbers entirely, apply weighted elimination:
- Skip numbers from the last 1-2 draws (lower probability zone)
- Emphasize numbers absent 5-20 draws (highest probability zone)
- Include some 21-40 draw numbers for coverage
- Avoid chasing 50+ day “overdue” numbers (statistical dead ends)
Turning Strategy into Tickets: Optimized Wheeling
Let’s say current data shows 18 numbers in the optimal 5-20 draw absence range. Using abbreviated wheeling, you can generate 10 strategic combinations that:
- Maximize coverage of the sweet spot numbers
- Include 1-2 moderate absence numbers per ticket
- Avoid recently drawn numbers from the last 2 draws
- Focus 70-80% of selections in the 5-20 draw zone
Example ticket set:
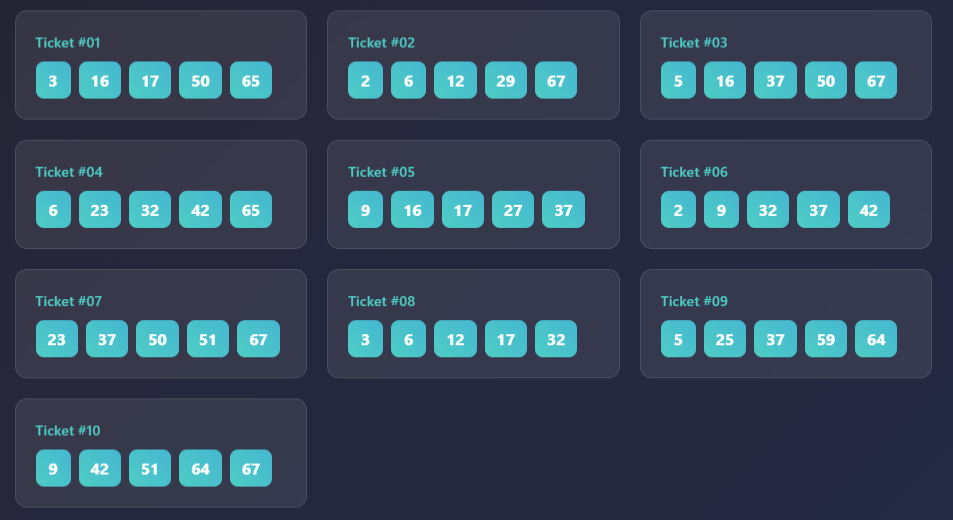
Each combination emphasizes numbers in the statistically verified reappearance window.
Managing Expectations
This system does not guarantee wins—Powerball remains a game of chance. However, it offers:
Data-backed number selection instead of random guessing
Higher probability targeting based on 15 years of results
Systematic approach that avoids common lottery myths
Improved partial match potential through smart wheeling
Think of it this way:
You can’t predict which numbers will hit, but you can focus on when they’re most likely to return.
The Science Behind the Strategy
Why do numbers cycle back quickly? Several factors contribute to this pattern:
- Mathematical clustering: With only 69 numbers and 5 drawn twice weekly, natural recycling occurs
- Sample size reality: Over 1,800+ draws, patterns emerge that contradict intuition
- Regression to mean: Numbers tend to appear at their expected frequency over time
Why “overdue” numbers fail: Numbers absent 50+ draws aren’t “building pressure”—they’re statistical outliers that may represent:
- Natural variance in random systems
- Numbers near their expected appearance frequency
- Mathematical noise, not predictive patterns
Practical Implementation
Weekly Process:
- Download current Powerball results and calculate days since last appearance for each number
- Identify the 15-20 numbers absent for 5-20 draws
- Generate 5-15 tickets using abbreviated wheeling focused on these numbers
- Track performance over 10+ draws to validate approach
Monthly Review:
- Analyze hit rates in different absence categories
- Adjust sweet spot range based on recent patterns (5-20 draws typically optimal)
- Refine wheeling strategy based on partial match performance
Final Thoughts
The Powerball Number Cycling System isn’t about certainty, it’s about applying real data to improve your odds within a game of chance. Instead of chasing lottery myths about “overdue” numbers, focus on the verified statistical sweet spot where numbers actually tend to reappear.
Success isn’t measured by jackpots alone, but by:
- More frequent partial matches (3/5, 4/5)
- Data-driven decision making
- Realistic expectations based on mathematical facts
- Strategic play rather than random selection
Sometimes, the best system is simply the one that aligns with reality.